

An accurate capacity estimation (e.g., total DC capacity in MW) is crucial for the successful development of utility-scale solar projects. It plays a vital role in project financing since it directly affects capital cost and energy yield, and thus has a strong influence over financial performance. Whether you're assessing a single site or sifting through multiple potential locations, having dependable estimations of system capacity can make a significant difference between a profitable project and a costly mistake.
PlantPredict has become the go-to cloud-based utility-scale solar modeling platform in the industry, earning the trust of developers, EPCs, and engineers worldwide due to its reliable predictions and user-friendly interface. With advanced algorithms and validation from respected industry experts, including Black & Veatch, Leidos, and DNV GL, PlantPredict provides the accuracy and credibility that stakeholders are seeking.
In this detailed guide, we'll take you step-by-step through the entire process of estimating plant capacity using PlantPredict — from setting up your project and selecting sites to interpreting simulation results.
By the time you finish this tutorial, you'll be equipped with the skills to quickly estimate project capacity for potential solar sites — a critical first step in the development process. This foundational assessment sets the stage for future analysis of energy yield, costs, and financial performance. For now, we'll focus solely on determining capacity, so let's roll up our sleeves and build your first site layout in PlantPredict.
To create a Utility-Scale Solar Yield and Land Capacity prediction, you first need to start a new project. If you haven't done so already, click on the "Projects" button in the left navigation panel. Next, locate the "Create New Project" button in the top-right corner of your screen and click on it.
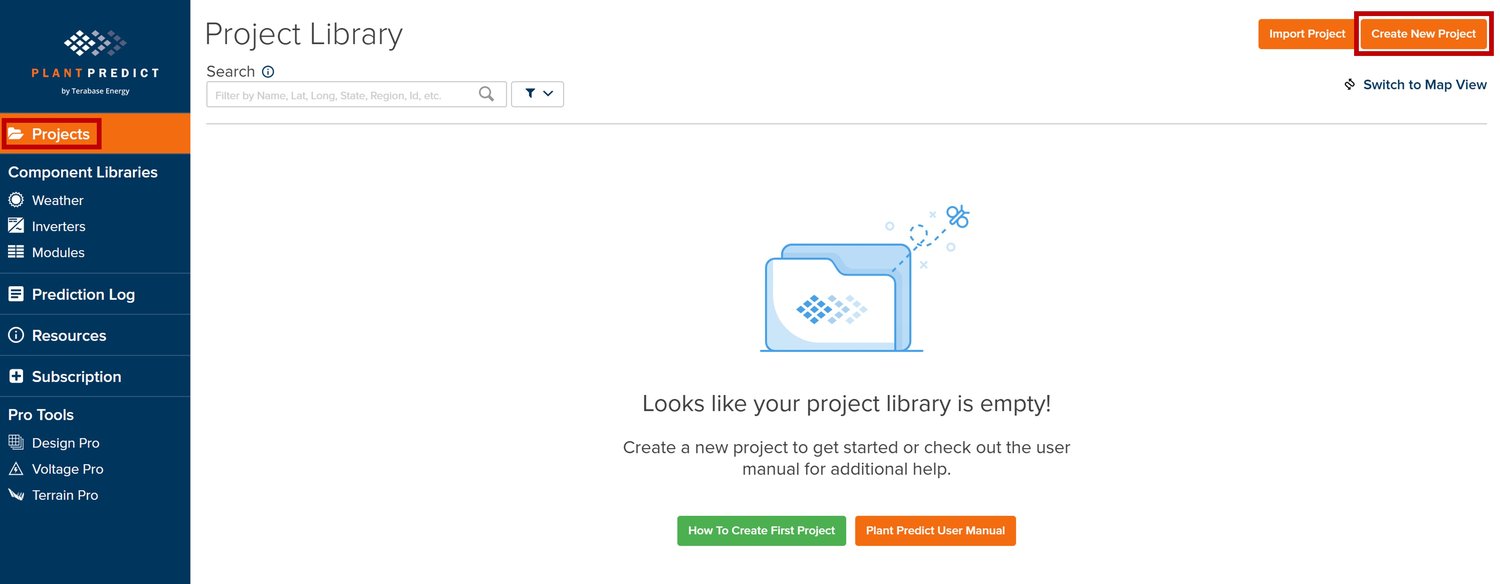
You'll now have the option to select the location of your parcel on the provided map and give a name to your project.
In this article, we'll run a prediction for a parcel located in Antioch, California, USA, with the following coordinates:
Name the project "My First Project" and click "Save New Project."

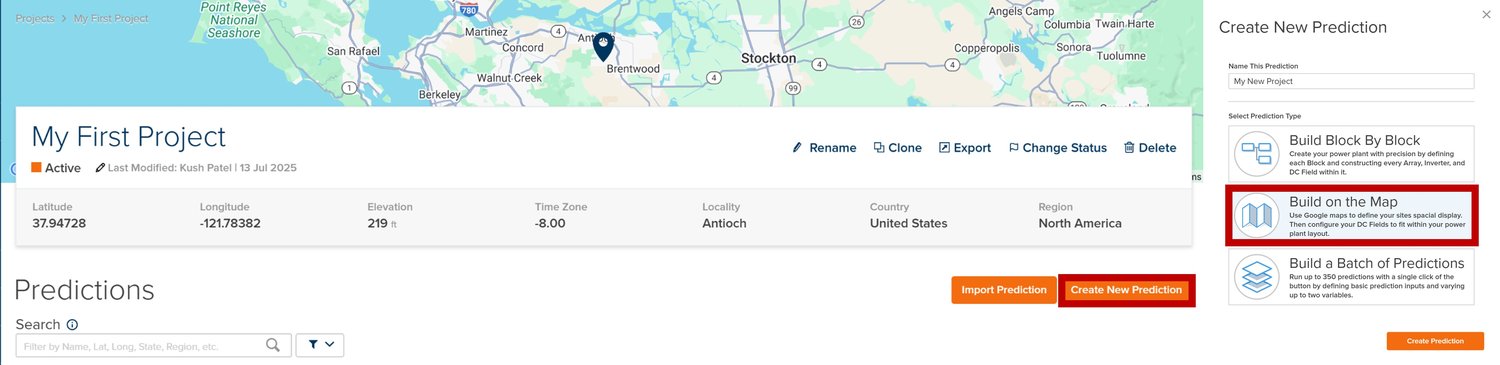
To generate a prediction, click on the "Create New Prediction" button.
A "Create New Prediction" dialog box will open. Give a name to this prediction, such as "My New Project." Select the "Build on the Map" option and click on "Create Prediction."
The "Build on the Map" option utilizes the geospatial map interface to determine the plant's capacity. However, if you already know the capacity, you can choose the "Build Block by Block" option and manually define individual blocks.
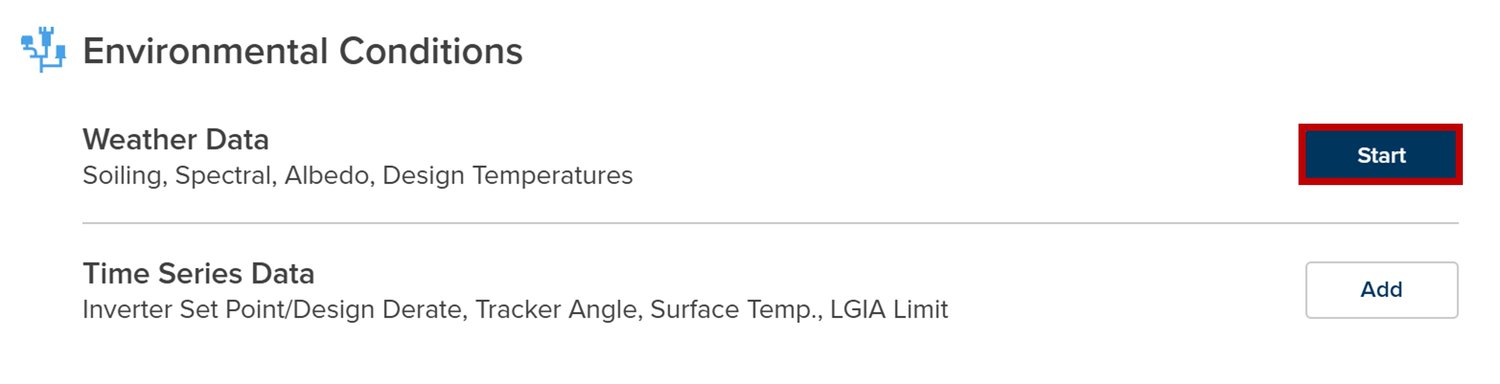
Now we'll add weather data information for our prediction. You can find the option to add weather data under the "Environmental Conditions" section. Click on the "Start" button.
Under the Selected Weather File option, click on "Add Weather." Select the first available weather data option. In this case, we selected the Meteonorm - 37.947N - 121.784W option. Once you've made your selection, click "Save Selection" and then choose "Save + Close Section" in the top-right corner of your screen.

The next part of the prediction will involve selecting Power Plant Configurations. To begin that process, click on the "Start" button next to the PV Blocks & Array option.

By default, you will have a panel with the Power Plant Parameters option on the left side of the screen. We will cover how to update this later, but for now, we'll change the option to Overlays by clicking on the Stacked Diamond option.
In the Map Overlays options, turn on the Parcels and switch to Satellite View by clicking the Satellite/Terrain view button located at the bottom left side of the screen.
You will notice that the parcel of interest looks like a square but has an angled cut or chamfer in the bottom right corner. Click on the boundary of the parcel and then choose the "Create Site Boundary" option.
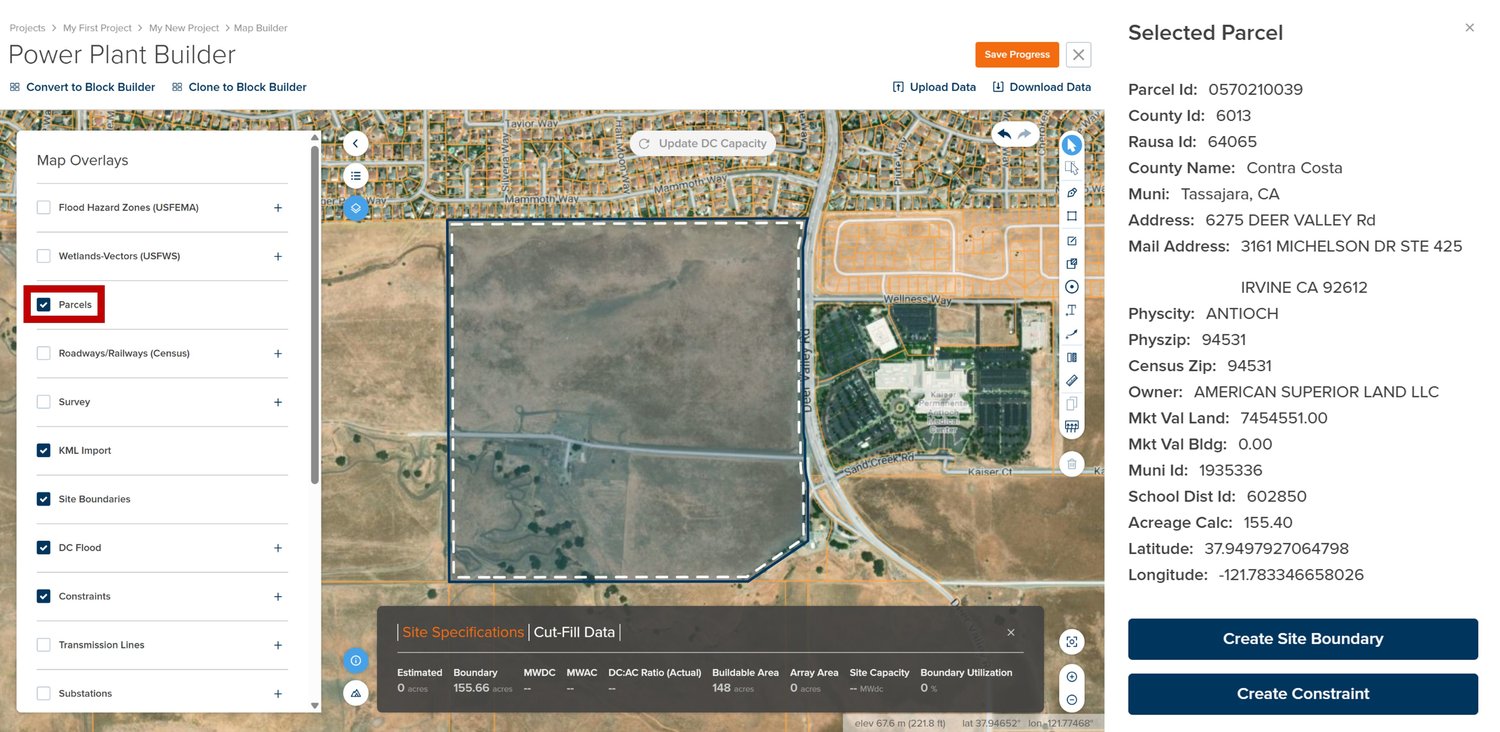
Alternatively, you can use the "Draw Site Boundary" option to create a boundary for your site manually. PlantPredict only has Parcel data for the United States, and for international sites, you will have to make a boundary. To do that, click the Draw Site Boundary button in the right option panel (located third from the top). This option will be less accurate, so we recommend using the parcel option whenever possible.
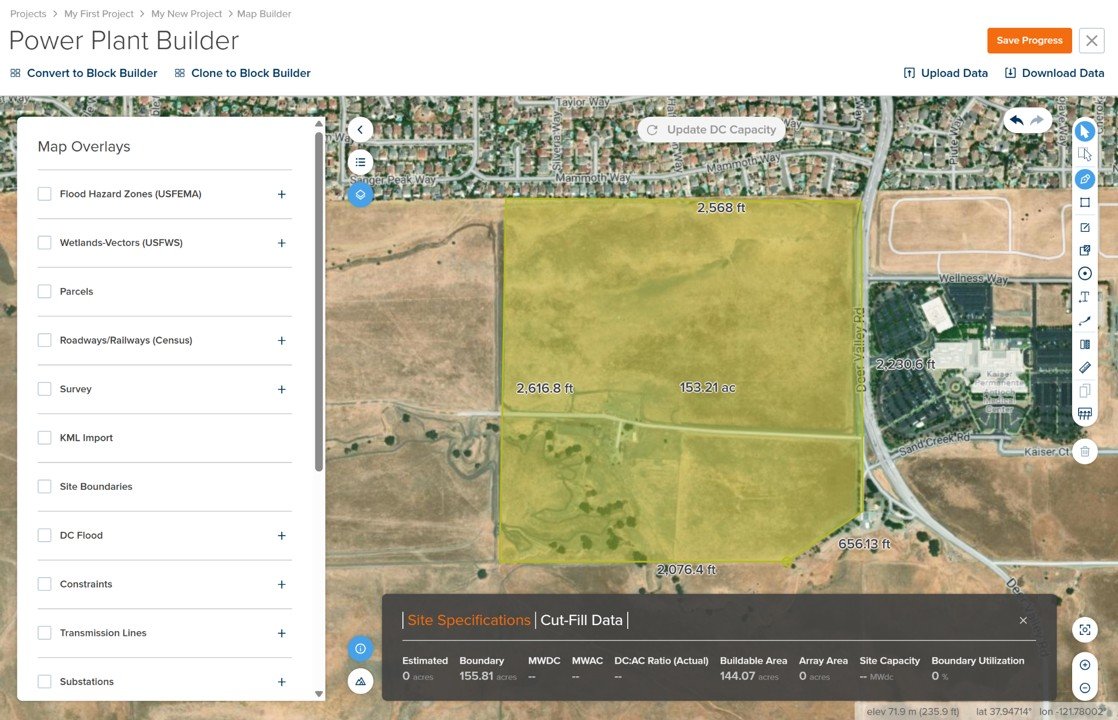
Next, we'll check if the site has any Wetlands by turning on the Wetlands layer in the Map Overlays panel. You'll notice that the parcel has wetlands in the bottom left corner.
Click on the wetlands, add the desired setback, and then click on "Create Constraint."
Once done, navigate back to the Power Plant Parameters Tab by clicking on the "hamburger icon" (three-line icon in the top-left side of the screen).

Now we'll add the inverter for our prediction by clicking on the "Add Inverter" button in the Power Plant Parameters table. Choose the Demo Central 2500 inverter.
Next, we'll add the Module configuration for our prediction by clicking on the "Add Module" button in the Power Plant Parameters table. Choose the FS-7540A-TR1 CdTe September2022 module option.
Other configurations that we will use or change are as follows:
For the remaining configurations, we'll go with the default values.

At this point, we have entered all the inputs for our prediction. To get the capacity estimation, click on the "Update DC Capacity" button (top-center of the screen).

You will notice that we are estimating 40.75 MWdc for this site. You will also notice this DC capacity is less than the 45 MWdc that we entered into the Power Plant Parameters. PlantPredict has used all available land area to try and meet the desired 45 MWdc. If more land area were available, PlantPredict would have stopped adding capacity once 45 MWdc was achieved.

Apart from the Parcel and Wetlands layers, PlantPredict offers several additional data layers, such as transmission lines, substations, and gas lines, which can significantly impact site assessment decisions. The Transmission Line provides information on existing electrical infrastructure, substation locations help determine connection points, and gas lines help determine any conflicts with proposed layouts.
For this site, we have electrical lines and a substation in close proximity, and no gas lines are running through the parcel.

Once you are done with the capacity estimation and automated layout, you can download the data in various file types, including KMZ, DXF, SHP, PVC, and CSV. You can also use this data in PlantPredict's other tools like Design Pro.
Alternatively, you can import your own KMZ or DEM file to set the boundaries for your layout. Learn more about these file types and their use in our Documentation.
When you're happy with the layout and capacity, it's time to move out of the Map Builder process and complete the prediction. The prediction provides annual energy yield, 8760 Report, and a lot more using the Map Builder design. Check out the blog on PV Simulation Report to learn how to complete the prediction and all the outputs that you can receive in PlantPredict.
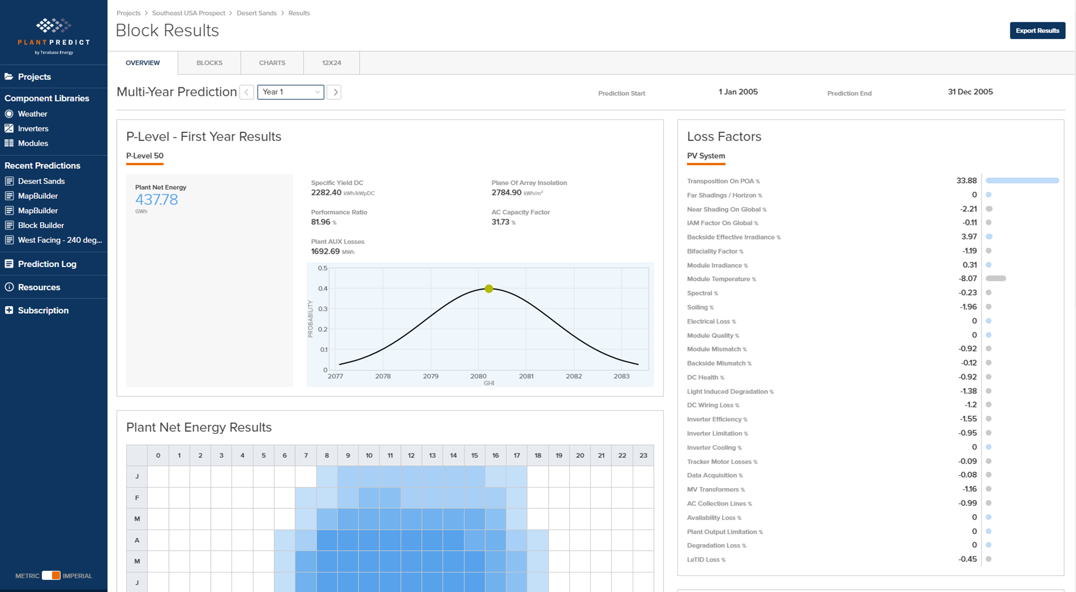
An effective PlantPredict screening process can significantly help development teams save time and money by identifying non-viable sites early on. Instead of spending months and potentially hundreds of thousands of dollars on detailed studies for sites that may not be suitable, teams can quickly evaluate numerous potential locations and focus their resources on the most promising ones.
The key is to establish clear go/no-go criteria from the beginning and use PlantPredict's rapid assessment tools to make informed decisions about which projects deserve further analysis and engineering investment.
You have now learned how to create an accurate plant capacity estimation using PlantPredict, from project setup to generating a layout while considering constraints and boundaries. These skills will enable you to efficiently evaluate potential solar sites and produce reliable capacity predictions that support informed investment decisions.
When your analysis in PlantPredict identifies promising sites with favorable capacity and suitable infrastructure conditions, you can then determine energy yield predictions. Based on the Map Builder design in PlantPredict, you can derive the annual energy yield prediction, download the 8760 report, and much more. PlantPredict enables you to quickly screen multiple sites for capacity, saving both time and money for your project.
Join hundreds of organizations that trust PlantPredict for bankable energy predictions. Start with a free account, get a free trial of Pro features, or book a demo with our team.