
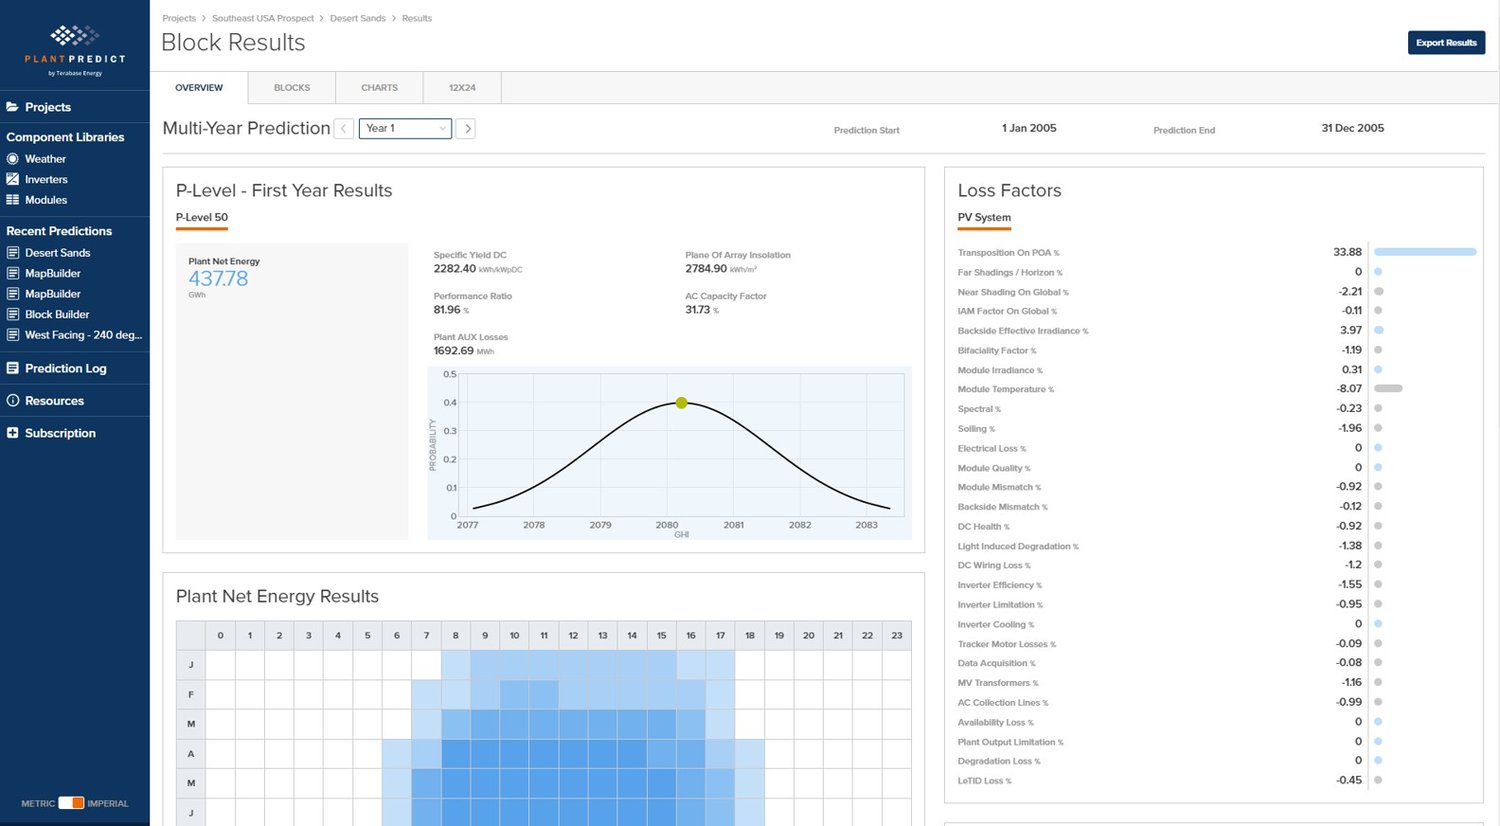
PV simulation reports, including the 8760 report and energy output summaries, are essential for understanding the expected performance of a utility-scale solar project. Tools like PlantPredict simplify the process of generating these reports. However, without proper interpretation, it is easy to draw wrong conclusions.
In this blog, we will discuss how to generate, read, and accurately interpret these results while avoiding common pitfalls that can lead to a misleading interpretation of performance.
An 8760 report is a comprehensive year-long energy forecast used in energy projects such as solar, wind, and battery storage. Instead of merely providing a yearly total, it offers a detailed hour-by-hour analysis of the estimated hourly electricity output for each of the 8,760 hours in a year (24 hours x 365 days). This report typically includes data on the following items for a Utility-Scale Solar Project:
In PlantPredict, you are not restricted to traditional hourly intervals. You can conduct sub-hourly simulations, such as 15-minute intervals, or even make predictions over multiple years. This flexibility means your results can include significantly more than the standard 8,760 data points. However, the term "8760 report" has become a standard in the industry, so when you download your results from PlantPredict, the file will still be labeled as an 8760 report for consistency.
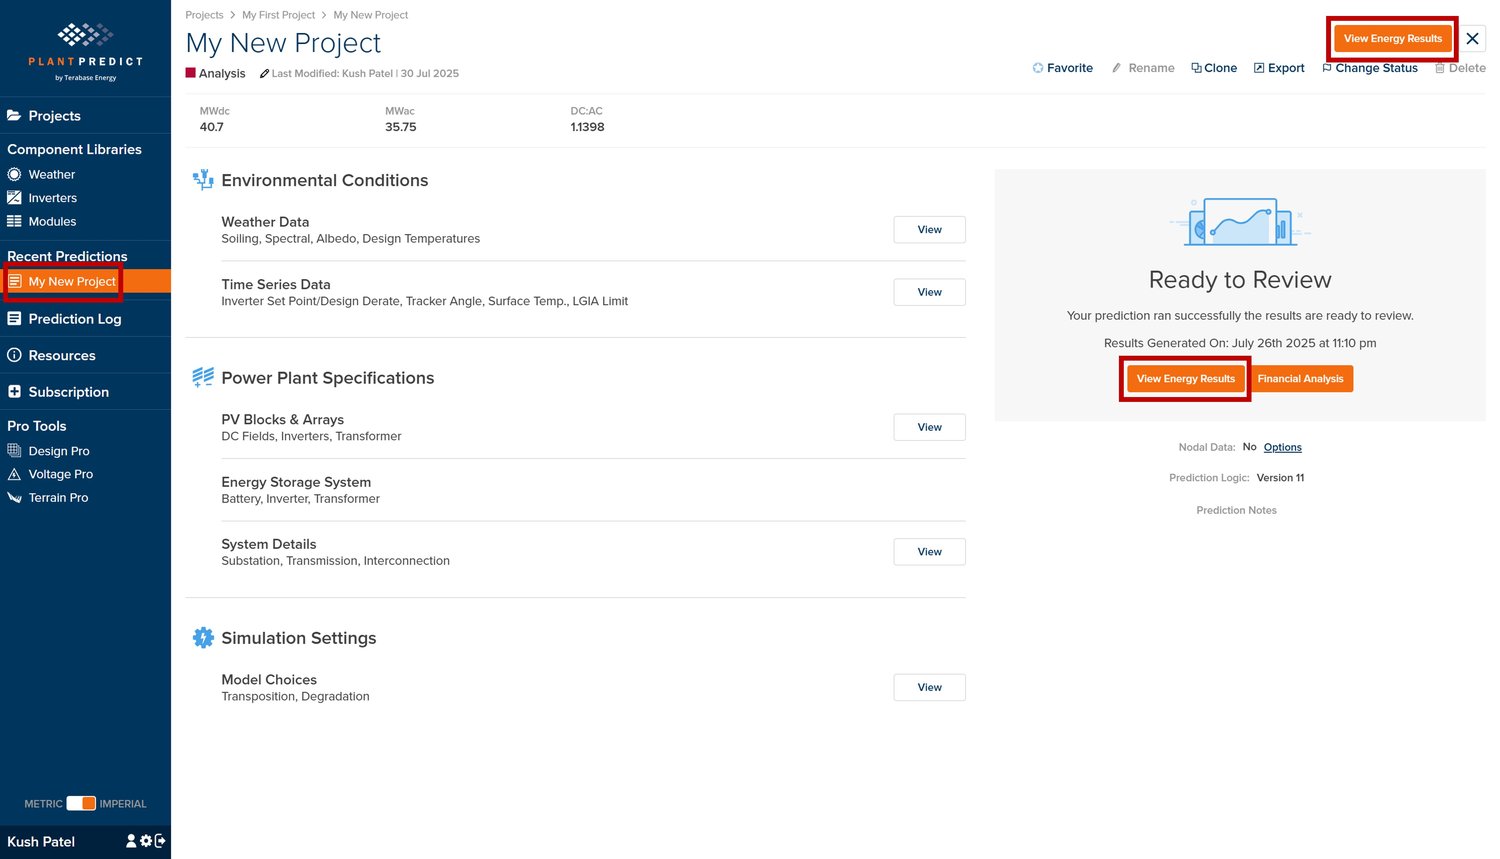
To access energy results and generate the 8760 report, you must first create an energy prediction in PlantPredict. Once the energy prediction is generated, click on View Energy Results. If you have already created a prediction, go to the Recent Predictions option to select your prediction, and then choose View Energy Results.
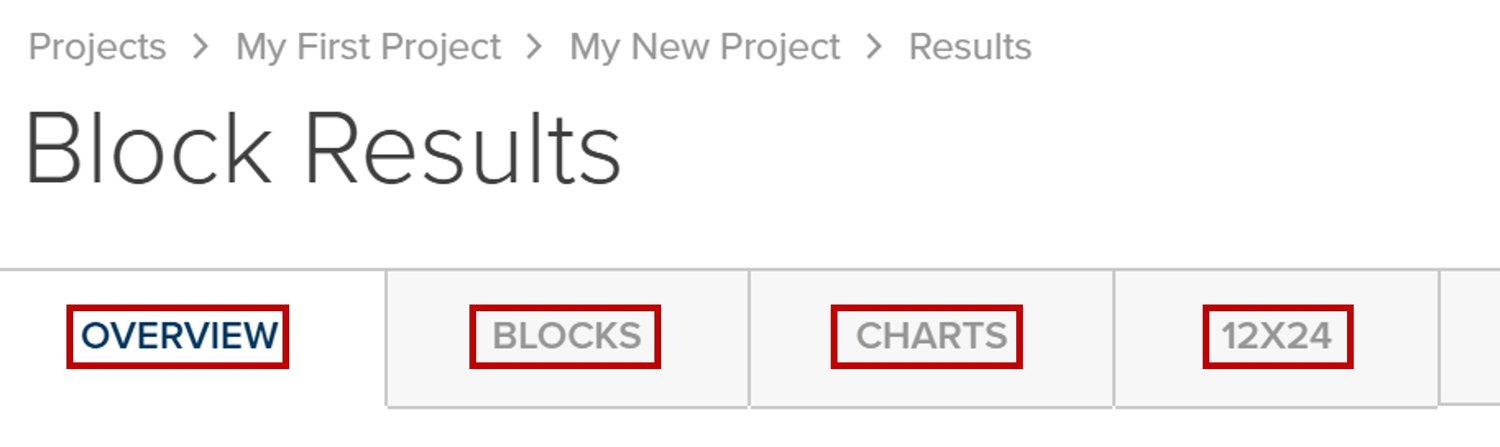
The results page features four tabs: Overview, Blocks, Chart, and 12X24.
It provides the input parameters for prediction and summary-level output for the entire one-year energy prediction. If you have a multi-year prediction, you will be able to select the specific year you would like to view, or you can view the composite for all years.

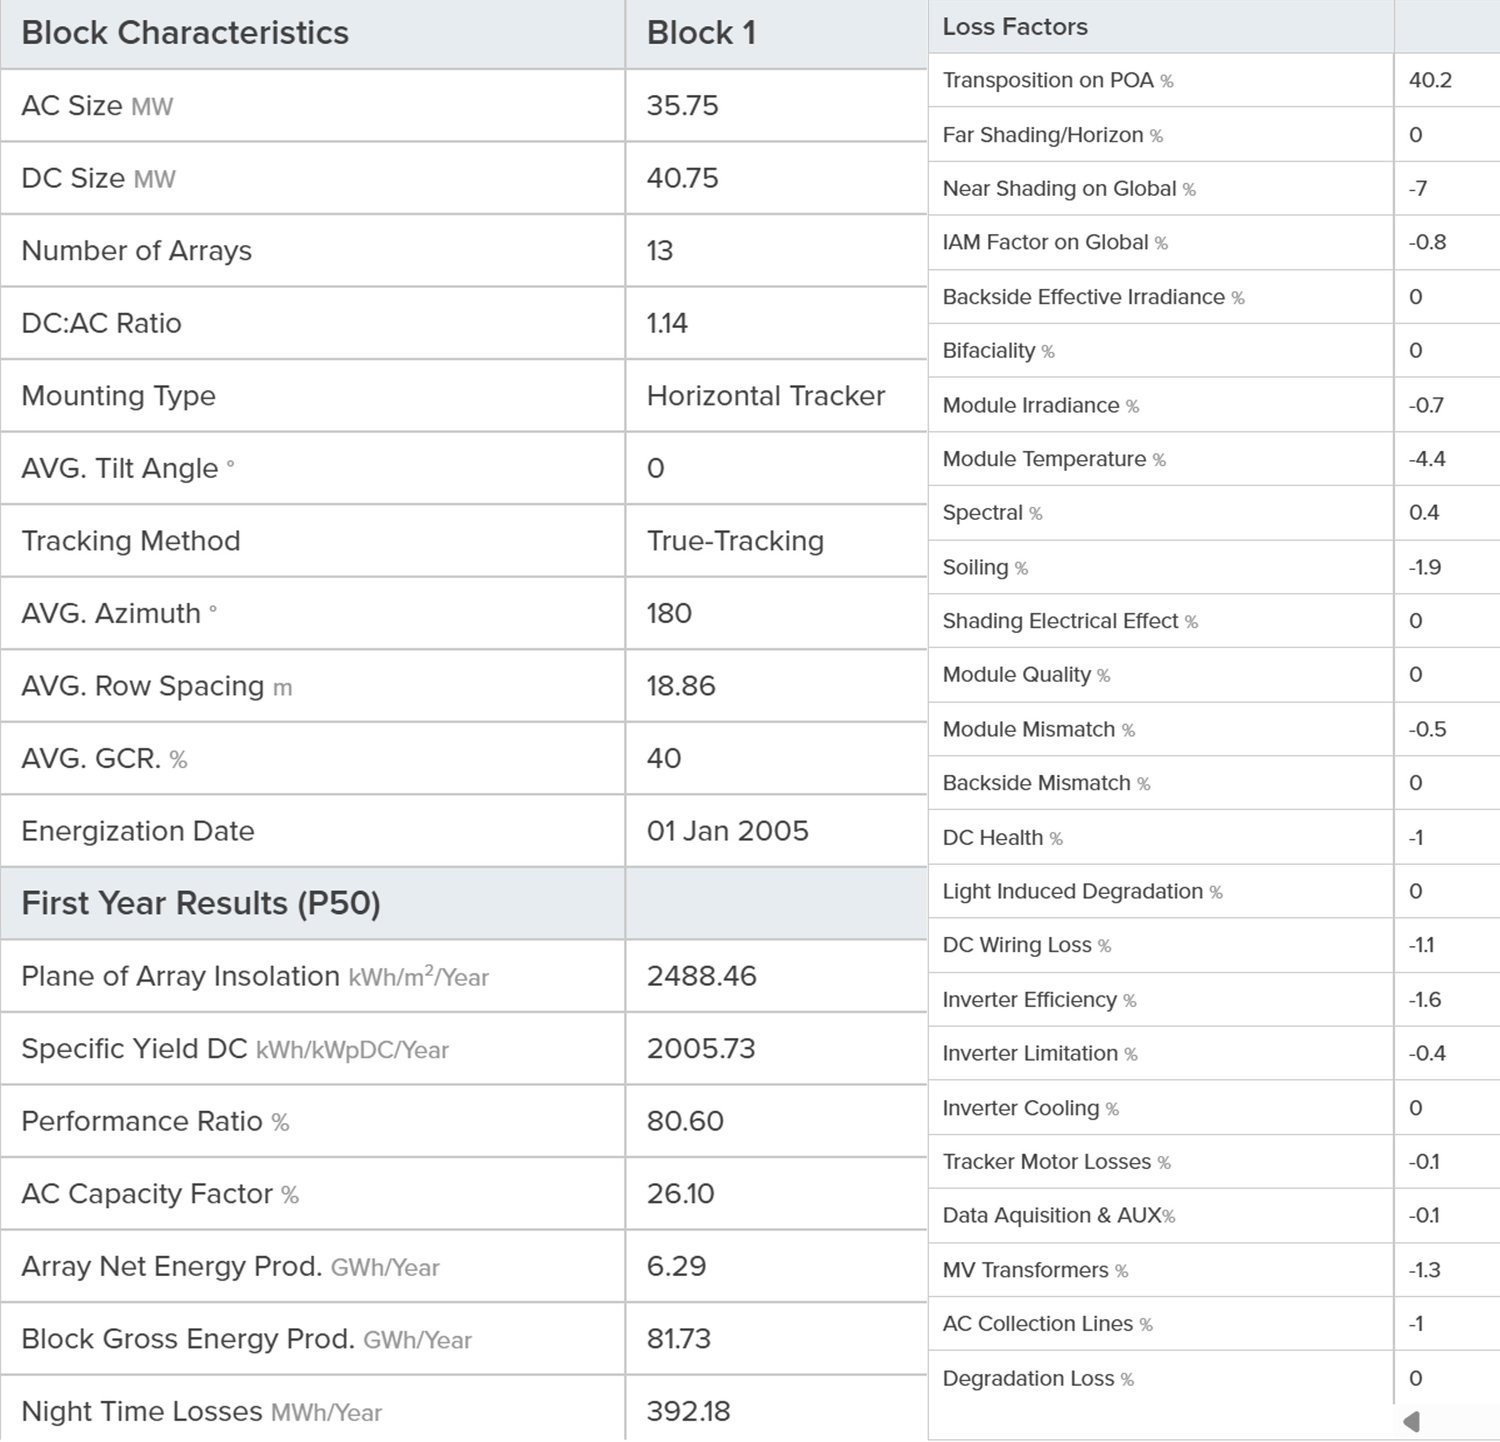
It provides Block Characteristics, First Year Results (P50), and Loss Factors in a table format. Blocks include all DC and MV AC system performance but do not include HV AC component losses such as HV transformers or HV transmission lines.
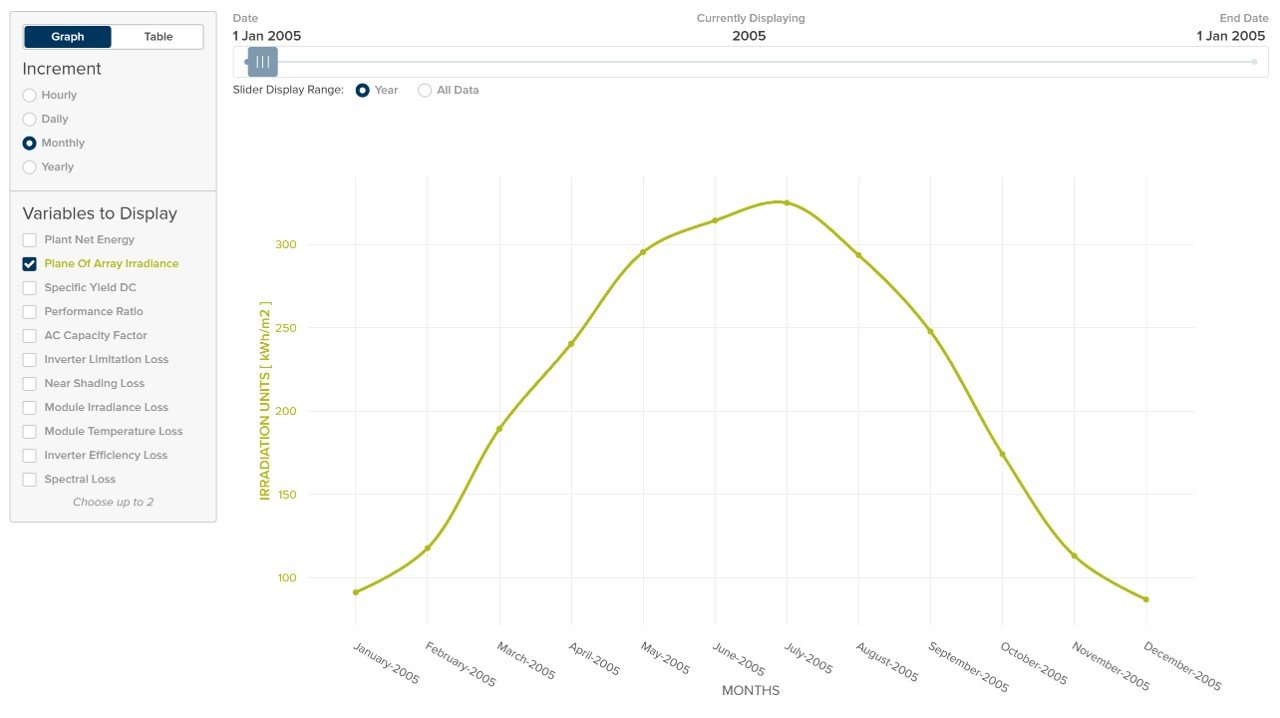
It generates an interactive graph or table for various variables at hourly, daily, monthly, and yearly increments. You can display up to two variables at once. Below is a list of variables that you can generate in PlantPredict:
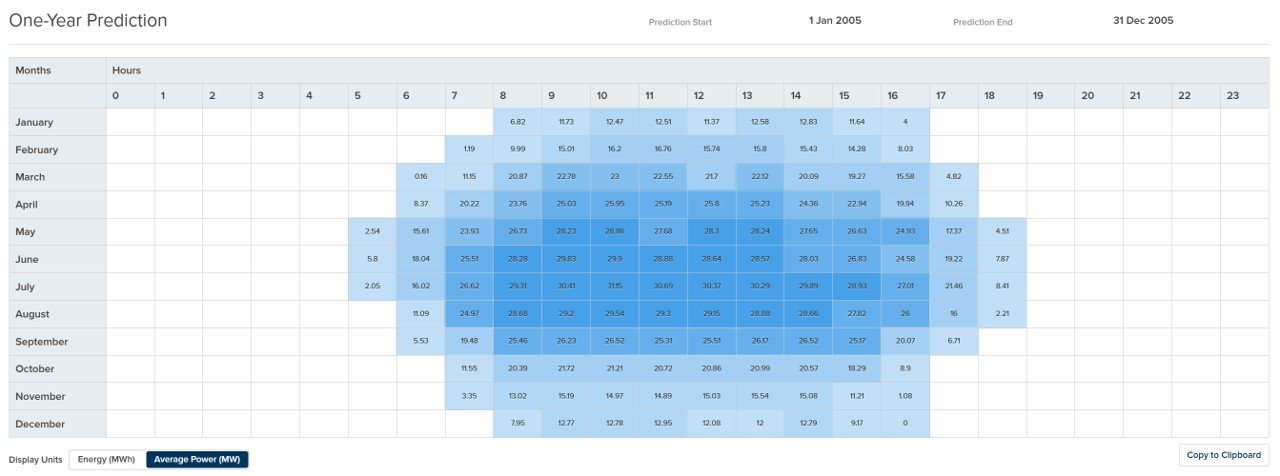
The 12x24 tab provides a heatmap that shows the amount of total energy or average power the system produces for every hour of the day across each month of the year. It's laid out as a 12 (months) x 24 (hours) grid, where each cell is color-coded — the darker the color, the more energy or power is being generated. This view makes it easy to spot both daily and seasonal patterns, allowing you to use that information to optimize the solar plant.
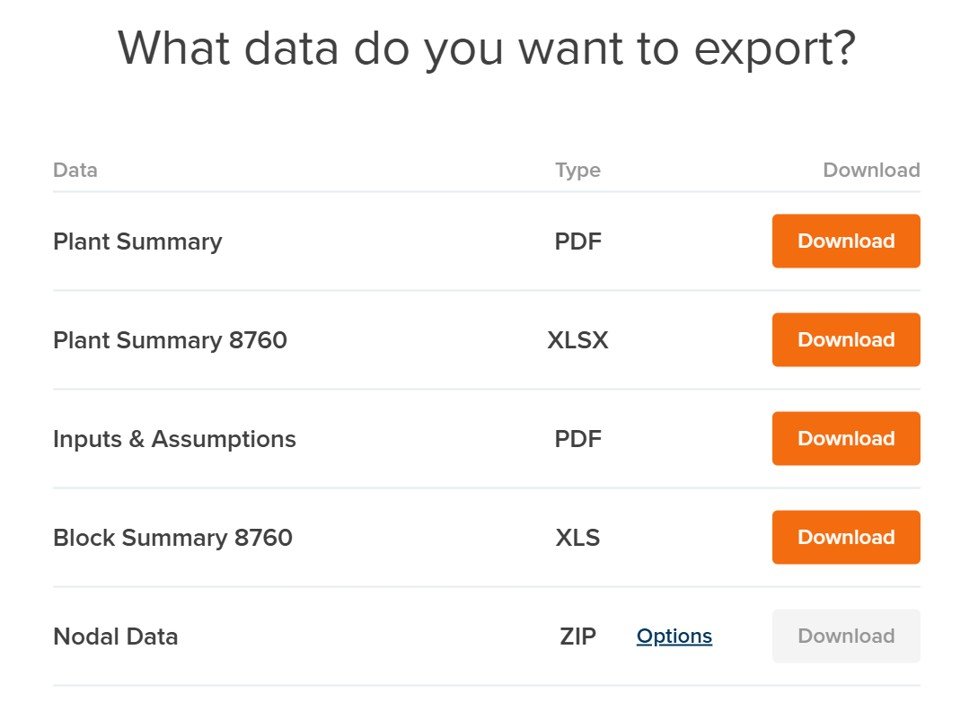
In the Energy Results tab, you'll find the Export Results button in the top-right corner. When you click on Export Results, you will have the option to export the Plant Summary, Plant Summary 8760, Inputs & Assumptions, Block Summary 8760, and Nodal Data.
Both the Plant Summary 8760 and the Block Summary 8760 provide hourly energy output data for the entire year. The Plant Summary 8760 presents all information in a compact format, while the Block Summary 8760 displays the same information in just two rows.
Nodal data provides even more detailed prediction data as compared to the 8760. It provides results for every time interval for every step in the prediction calculation process. As such, the nodal data files can be quite large and must be selected prior to running the prediction.
A loss factor table for utility-scale solar systems assigns loss percentages to variables that decrease (or in some cases, increase) the theoretical idealized energy production.
In PlantPredict, the Loss Factor Table consists of approximately 25 different variables (although this can vary slightly depending on system configuration) that influence system performance. Variables that contribute to energy loss are indicated with a negative sign and represented visually by a gray bar, reflecting the magnitude of the loss. Conversely, variables that have a positive impact or boost energy production are displayed with a blue bar.
To identify opportunities for improved performance using the Loss Factor Table, begin by pinpointing the variables that are contributing the most to losses or are easily influenced by design choices. In the Loss Factor Table below, the five primary opportunities for optimizing the solar plant are outlined as follows:
Large Losses (> 1%):
Losses Easily Influenced by Design Choices:

For large losses that cannot typically be easily influenced by design choices (such as Module Temperature or Inverter Efficiency), it may be worth double-checking that prediction inputs are set up correctly. For example, module thermal model settings or incorrect string lengths can all lead to large losses but are not typically influenced by reasonable design choices.
On the other hand, below is a table showcasing variables that can be easily influenced through design choices, along with various methods for improving them.
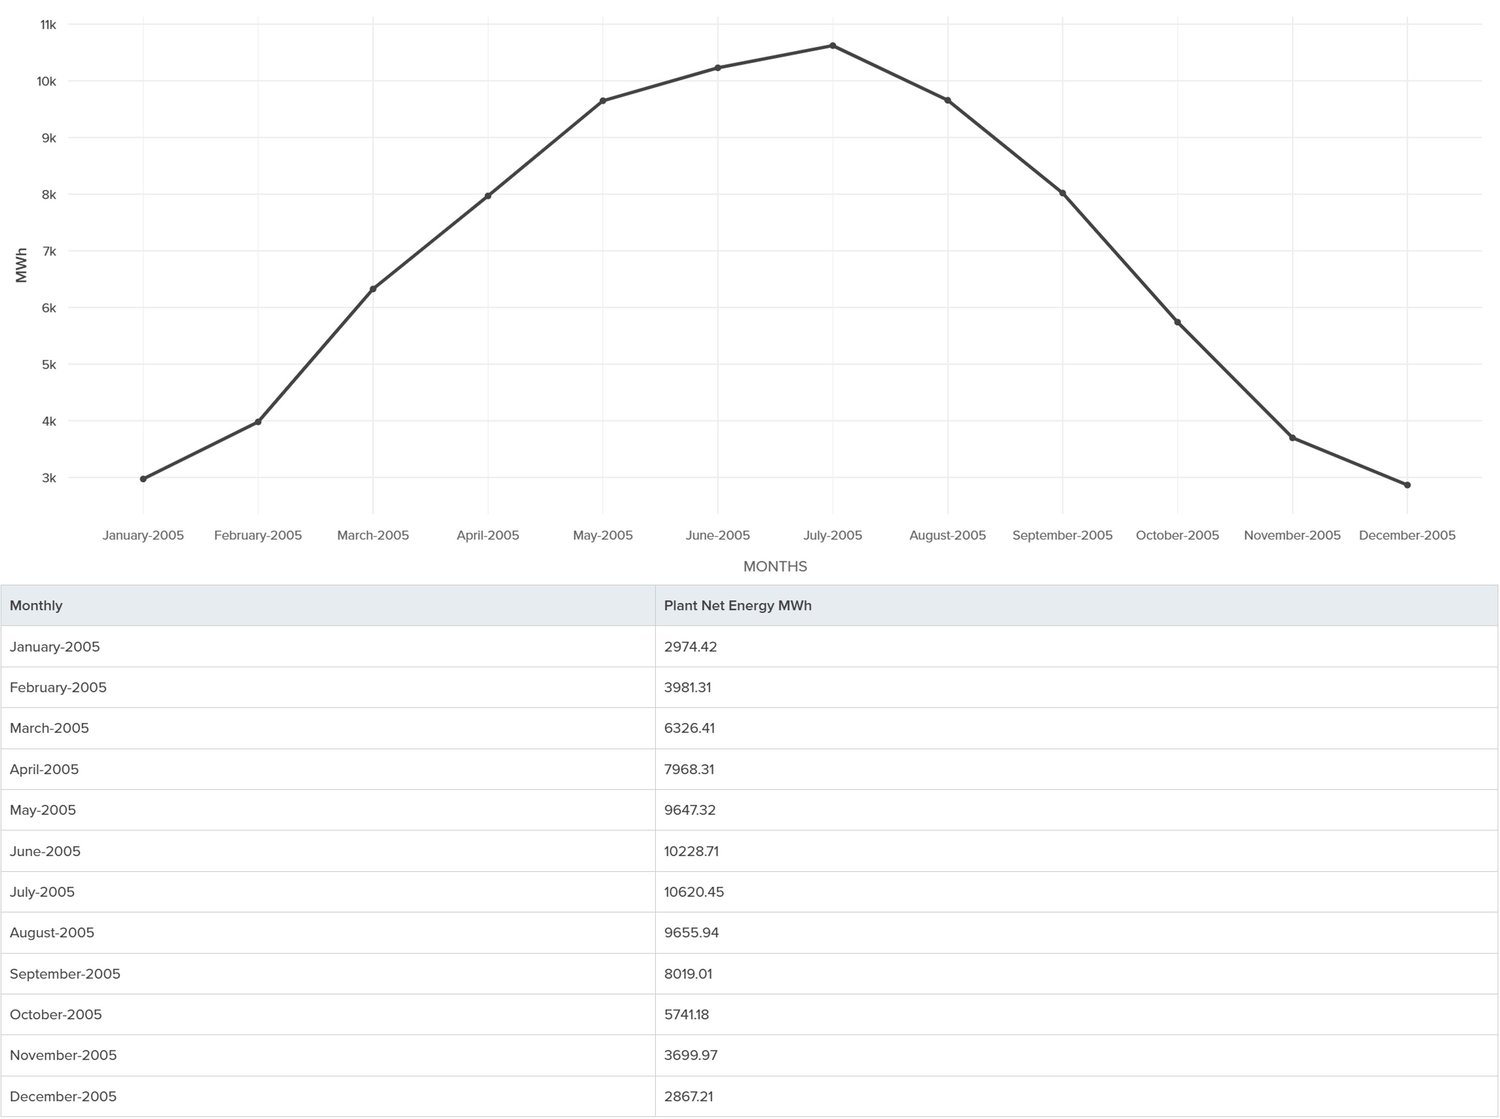
To generate a monthly energy production graph and table, navigate to the Charts section of the Energy Simulation. Select Monthly for the increments and Plant Net Energy for the variables to display. You can toggle between the graph and table based on your output preference.
In the graph, the y-axis represents the months, while the x-axis displays the energy in MWh. This visual representation effectively shows how energy is generated throughout the year. If you prefer to see the numerical data for each month, you can switch to the table option to view the monthly energy quantities.
You will notice from the graph below that energy production is higher during the summer months and lower during the winter months.
Capacity Factor and Performance Ratio are two key performance indicators (KPIs) for any utility-scale solar project.
The capacity factor represents the ratio of actual energy generated by a power plant to the theoretical maximum energy it could produce if it operated at full rated capacity continuously. A high capacity factor suggests that the site experiences strong irradiance and/or has long hours of sunlight. In contrast, a low capacity factor may result from cloudy weather, shading, shorter days, or system outages.
The performance ratio (PR) measures the actual energy output of a solar installation compared to the theoretical energy output under the site's actual irradiance, assuming there are no losses. A high performance ratio indicates that the system operates efficiently with minimal losses. In contrast, a low performance ratio points to potential losses due to shading, soiling, high temperatures, equipment faults, or clipping.
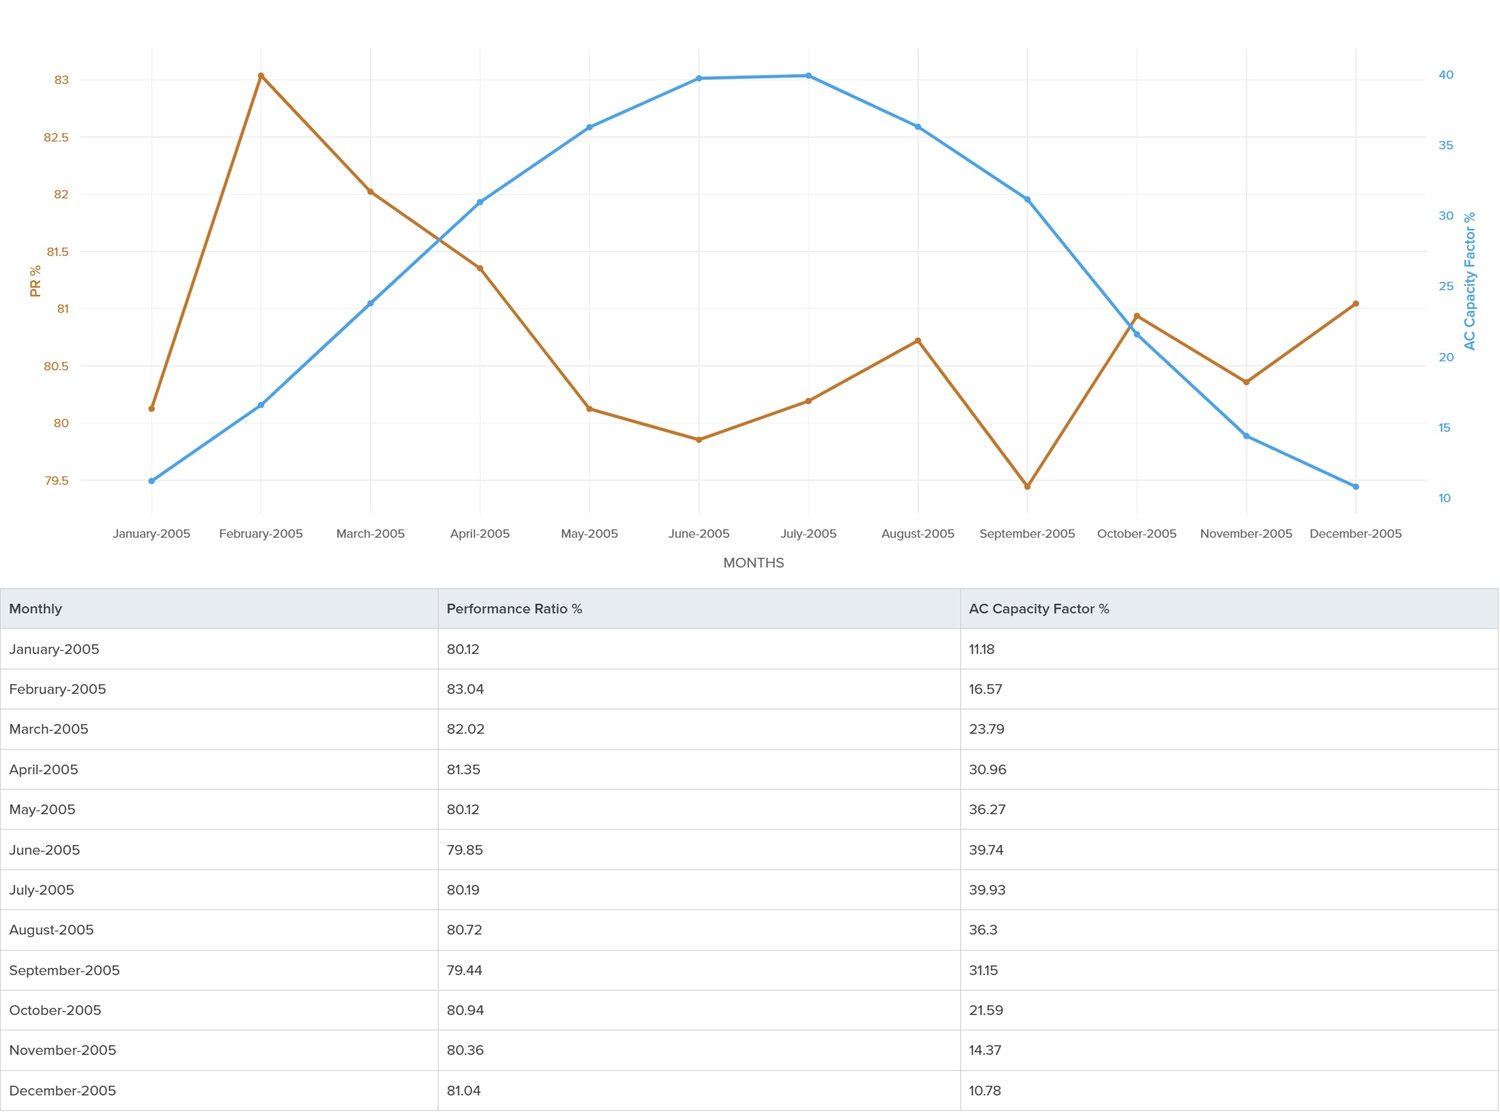
In the chart below, we display both the performance ratio and AC capacity factor over a 12-month period. You will observe that the performance ratio tends to be higher during the winter months, while the AC capacity factor is generally higher in the spring and summer months.
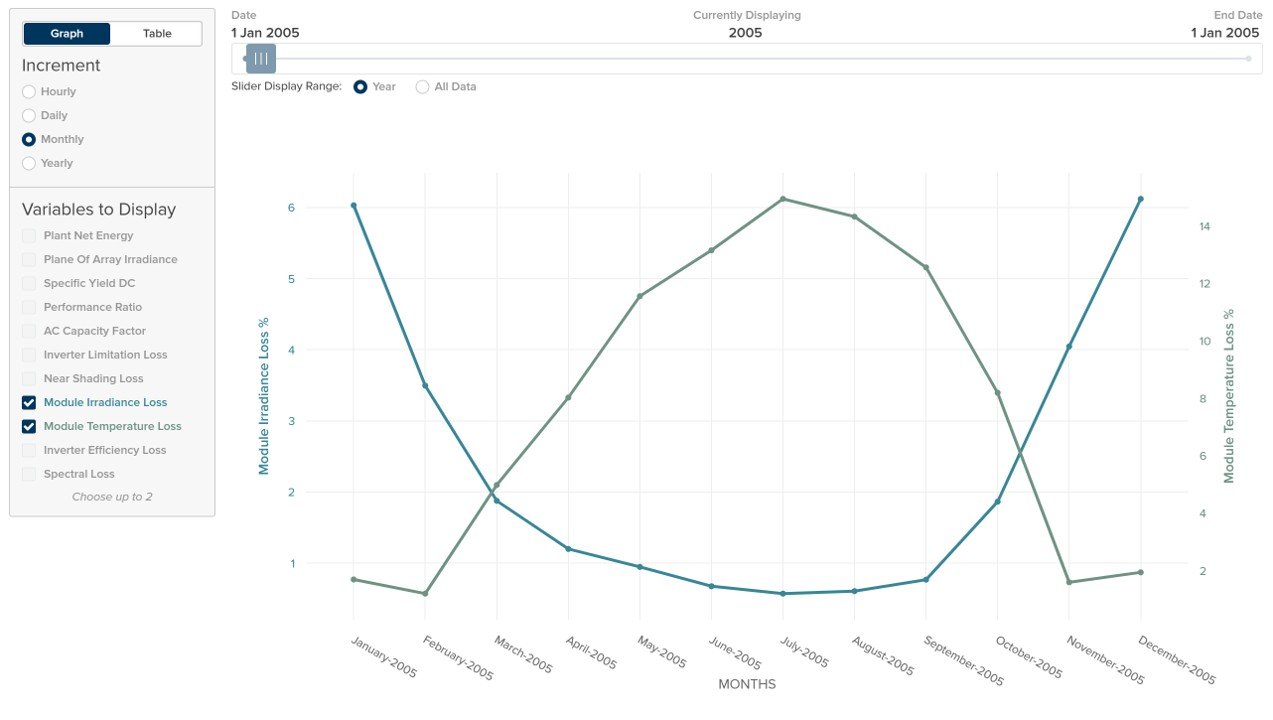
In the Chart section, you can also choose to compare two variables from a prediction side by side. Simply select the two variables and the increment. In the example below, we have chosen the variables Module Irradiance Loss and Module Temperature Loss, both on a monthly increment, for comparison.
Irradiance loss and temperature loss both affect module efficiency. Irradiance loss occurs when less light is captured, typically due to the sun's lower angle or cloudy weather conditions. Meanwhile, temperature loss is the result of heat accumulation in the modules, which can diminish their electrical performance.
If you look at the comparison graph, you'll see that irradiance loss is more significant during the winter months, while temperature loss tends to be higher in the summer. This illustrates how seasonal variations in sunlight angle and temperature affect a utility-scale solar plant's performance.
This comparison is useful in the following scenarios:

Generating a PV simulation report has never been easier! Thanks to modern technology and automation, you can quickly create charts, metrics, and summaries in just a few minutes. However, this convenience has a downside: it is equally easy to arrive at incorrect conclusions.
Misinterpreting performance metrics or overlooking critical context can lead to poor decisions, costly inefficiencies, or even inaccurate project evaluations. Here are seven common mistakes frequently encountered in PV reports, along with tips on how to avoid them.
Mistake #1: Comparing Performance Ratio and Capacity Factor directly
Avoid this mistake by recognizing that Performance Ratio measures system efficiency, while Capacity Factor reflects site productivity. Use each in the proper context and don't expect them to match.
Mistake #2: Assuming high energy means good performance
Avoid this mistake by using the Performance Ratio or Specific Yield to assess how well the system converts available sunlight into energy.
Mistake #3: Trusting 0% loss values without verification
Avoid this mistake by verifying that the loss (e.g., shading, soiling) was accurately modeled. Sometimes 0% loss was used because data was missing.
Mistake #4: Confusing DC capacity with AC output
Avoid this mistake by understanding that the DC capacity indicates the maximum amount of power solar panels can produce. In contrast, the AC energy output is the actual energy delivered to the grid, which takes into account inverter losses, clipping, and other system inefficiencies.
Mistake #5: Relying only on annual performance metrics
Avoid this mistake by reviewing and accounting for monthly or seasonal data to identify issues such as soiling, shading, and inverter clipping.
Mistake #6: Mistaking inverter clipping for peak performance
Avoid this mistake by looking beyond flat-topped power curves, as they may seem to indicate peak performance, but can actually signal inverter clipping. Instead, focus on the system's DC/AC ratio and monitor high irradiance periods when the inverter may be limiting its output.
Mistake #7: Assuming model results reflect reality exactly
Avoid this mistake by regularly validating and updating simulations using real-world data, including weather, maintenance logs, and equipment behavior.
When interpreting PV simulation reports, it's important to focus not only on the numbers but also on their meaning. Confusing capacities, overlooking seasonal trends, or misinterpreting performance indicators can lead to significant errors. By being aware of these common pitfalls and carefully examining the data, you can make more accurate evaluations, avoid costly assumptions, and ultimately increase the value of your solar investment.
I hope this blog has helped you understand the basics of the PV Simulation Report and the 8760 Report. When you're ready to create your own detailed energy predictions and reports, sign up for a free PlantPredict account and start modeling your first solar project in just a few minutes!
Join hundreds of organizations that trust PlantPredict for bankable energy predictions. Start with a free account, get a free trial of Pro features, or book a demo with our team.