Fast Utility-Scale Solar Cost & LCOE Modeling from Concept to Approval
As utility-scale solar projects continue to grow worldwide, it is increasingly important to ensure accurate financial estimates alongside proper technical design. Developers, investors, and stakeholders all depend on accurate projections to assess whether a project is feasible, secure funding, and maximize long-term returns. Advanced financial estimation isn't just about basic cost modeling; it combines system design, performance analysis, and market trends to create solid financial metrics like Levelized Cost of Energy (LCOE), Internal Rate of Return (IRR), and Net Present Value (NPV).
Design Pro by Terabase is an exceptional tool that enables advanced financial estimation for utility-scale solar projects. By simulating realistic system layouts and production outputs, this tool allows stakeholders to quickly and accurately estimate LCOE, IRR, and NPV. This ensures that design decisions are aligned with financial goals.
In the utility-scale solar sector, even minor differences can have a significant impact due to the high capital intensity and scale of these projects. Therefore, this kind of integrated estimation is essential for developing bankable and competitive solar projects.
What is Levelized Cost of Energy (LCOE)?
The Levelized Cost of Energy (LCOE) is the total lifetime cost of building, operating, and maintaining a power plant, divided by the total electricity it generates over its lifespan. Expressed in cost per megawatt-hour (MWh), it incorporates:
Capital Expenditures (CAPEX): Land, equipment, interconnection, and installation
Operating Expenditures (OPEX): Maintenance, cleaning, monitoring, and insurance
Performance Factors: Energy yield, system degradation, and availability rates
For utility-scale solar, LCOE isn't just a statistic — it's the measure that determines whether a project can compete in the market, secure financing, and win long-term PPAs.
Design Pro not only creates solar layouts and determines energy yield, but it also estimates the Levelized Cost of Energy (LCOE), EPC costs, and other financial costs related to utility-scale solar plants. This feature aims to assess the economic feasibility of a utility-scale solar plant before any investment is made in its construction.
Financial Inputs
When generating a scenario, Design Pro utilizes default cost inputs, but you have the option to change these default inputs. In the section below, we will examine these financial parameters and the default inputs provided.
EPC Cost
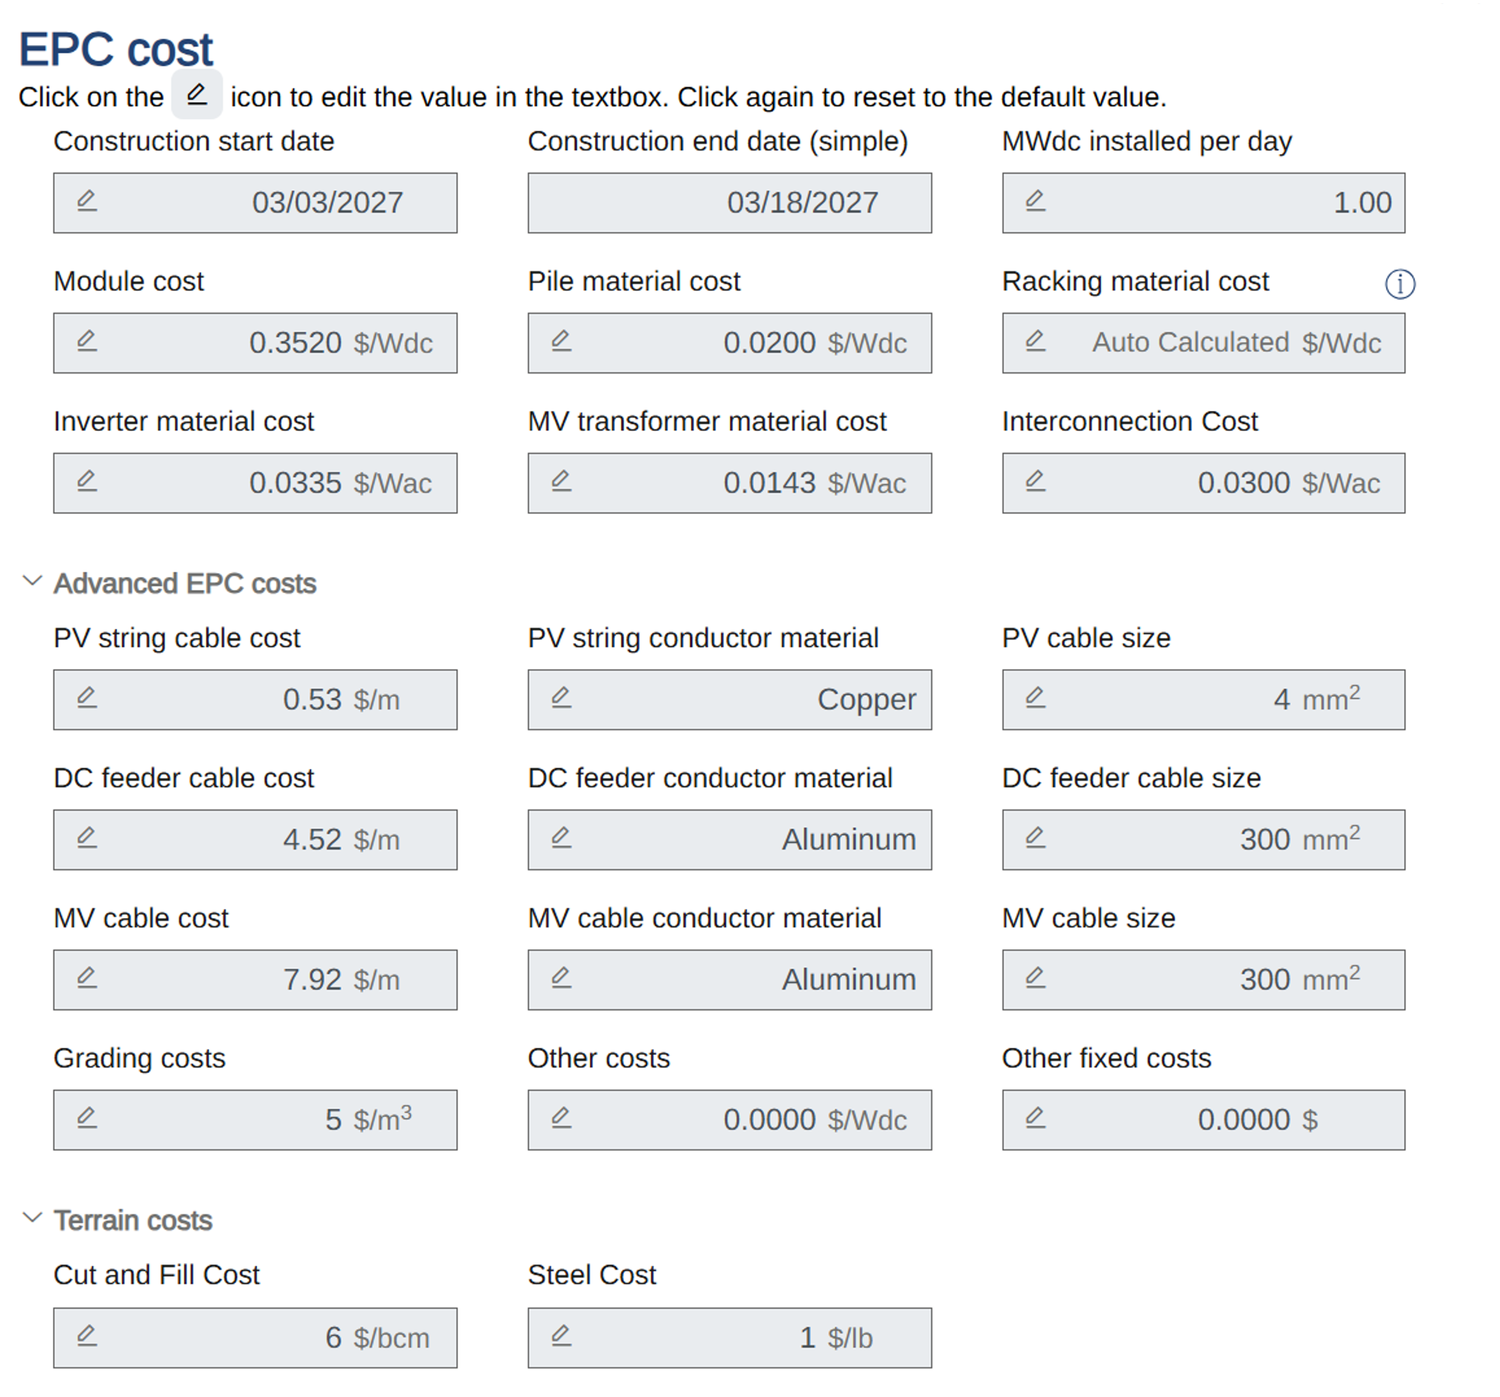
EPC cost stands for Engineering, Procurement, and Construction cost related to a project. When we talk about utility-scale solar, it refers to the overall expenses involved in designing, sourcing, and constructing the solar power plant. The EPC Cost section is divided into three parts:
Basic Cost
Advanced EPC Cost
Terrain Cost
Category
EPC Cost
Explanation
Default Value
Basic Cost
Construction Start Date
The official start date for physical work on the project site, which comes after all the necessary permits, contracts, and financing are secured.
03/03/2027
Construction End Date (simple)
The date when all the major construction tasks are finished and the plant is mechanically complete, ready for commissioning.
03/18/2027
MWdc Installed per day
The amount of solar capacity, measured in DC megawatts, that is physically built and installed on-site each day.
1.00
Module cost
The cost of purchasing solar panels, typically the most significant single material cost in the EPC budget.
0.3520 $/Wdc
Pile material cost
The expense of steel piles that are driven into the ground to support mounting structures or trackers.
0.0200 $/Wdc
Racking material cost
The cost of all metal components that support and secure solar modules, including torque tubes, rails, fasteners, and bearings.
Auto Calculated $/Wdc
Inverter material cost
The cost of central or string inverters. It affects both the efficiency of AC conversion and the overall layout.
0.0335 $/Wac
MV transformer material cost
The cost of medium-voltage transformers that step up power from inverters to the site's medium-voltage grid.
0.0143 $/Wac
Interconnection cost
Expenses associated with connecting the solar plant to the utility grid, including substations, switchgear, metering, and utility fees.
0.0300 $/Wac
Advanced EPC Costs
PV string cable cost
The cost of cables connecting modules in series. It affects voltage drop and thermal performance.
0.53 $/m
PV string conductor material
The cost of the conductor used in MV cables. The type of material used affects conductivity.
Copper
PV cable size
The cross-sectional area of PV string cables affects current capacity and voltage drop characteristics.
4 mm²
DC feeder cable cost
The cost of larger DC cables that aggregate multiple PV strings to combiner boxes or inverters.
4.52 $/m
DC feeder conductor material
The cost of the conductor used in DC feeder cables.
Aluminum
DC feeder cable size
The cross-sectional area of DC feeder cables, selected based on current rating and voltage drop criteria.
300 mm²
MV cable cost
The cost of purchasing MV cables, which are used to connect transformers to switchgear, collection systems, or substations.
7.92 $/m
MV cable conductor material
The cost of the conductor used in the MV cables.
Aluminum
MV cable size
The cross-sectional area of MV cables, chosen based on system current, thermal rating, and allowable losses.
300 mm²
Grading costs
The cost of earthwork activities for tracker installation, access road, and drainage.
5 $/m³
Other costs
Miscellaneous EPC items include fencing, security, signage, and temporary site office setup.
0.0000 $/Wdc
Other fixed costs
Non-variable costs that remain constant regardless of system size, such as permitting, design fees, mobilization, and certain administrative expenses.
0.0000 $
Terrain Costs
Cut and Fill cost
The cost of soil export or backfill import for the site.
6 $/bcm
Steel cost
The cost of steel used for the site, beyond piles and racks; includes items such as inverter skids, fencing, and support frames.
1 $/lb
Financial Inputs
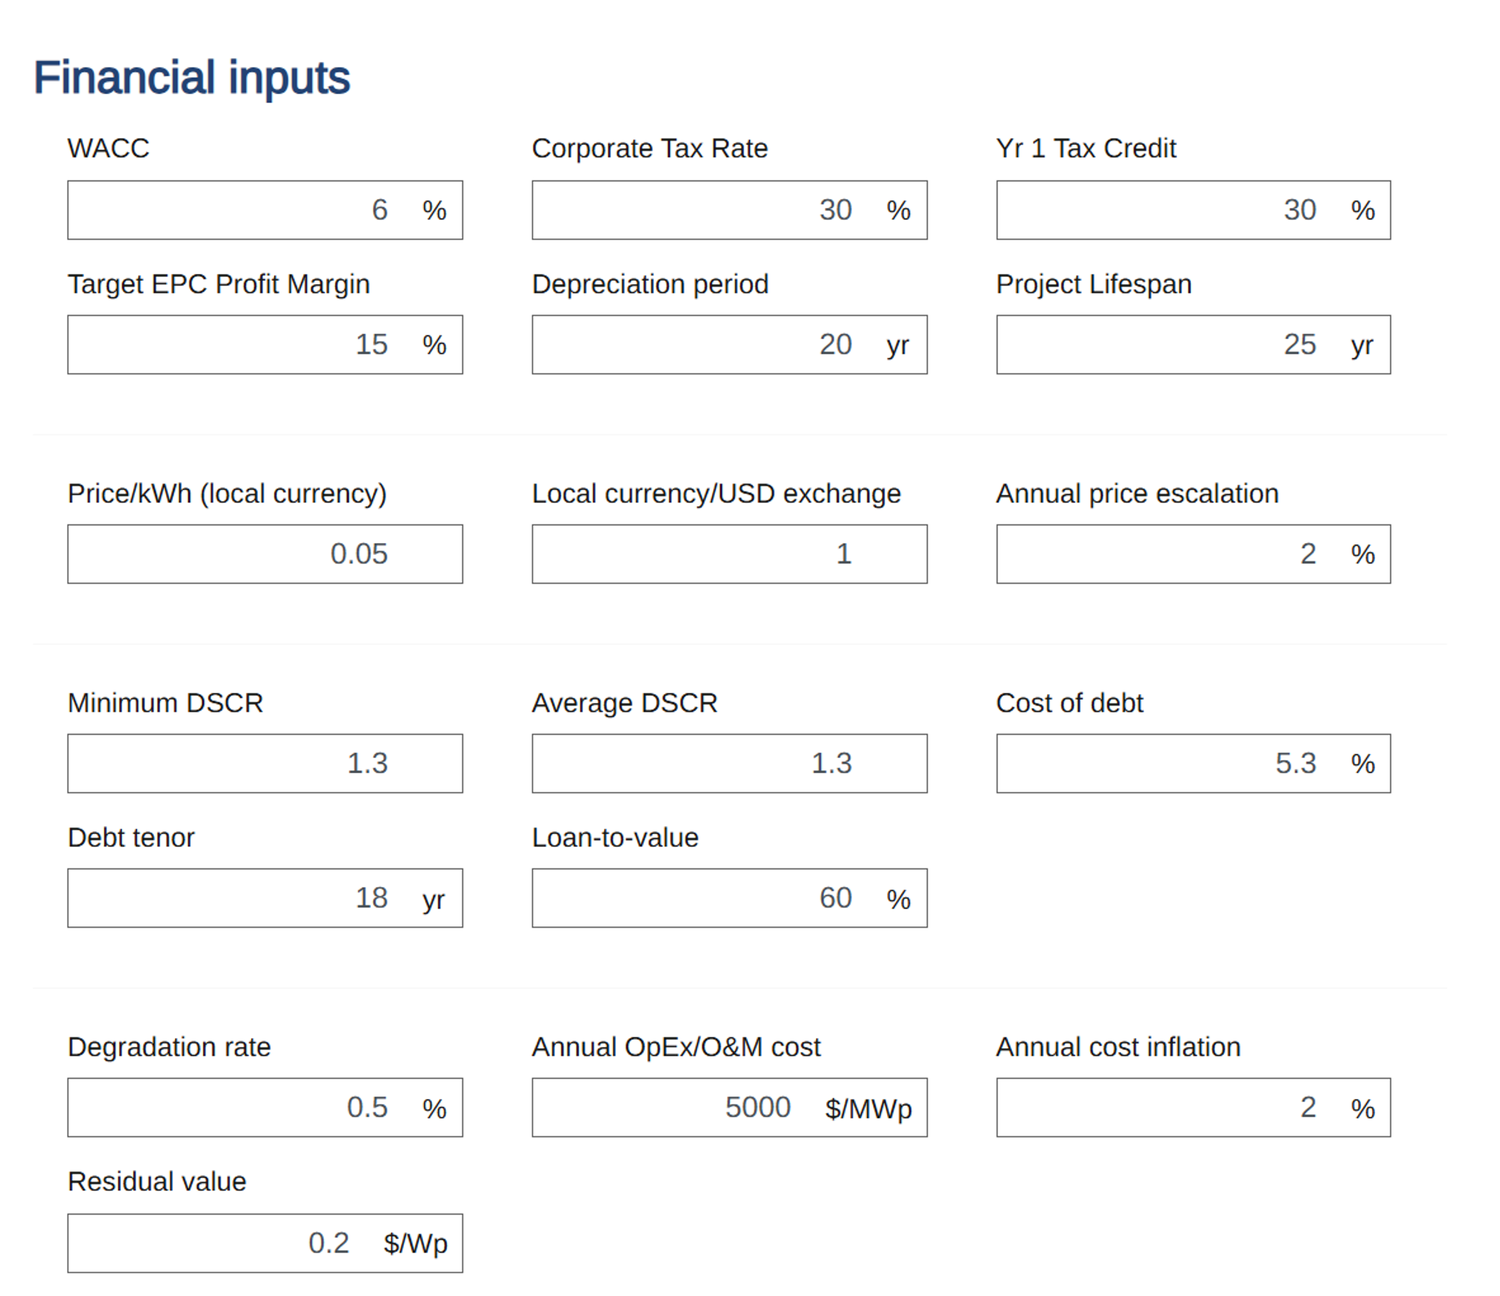
The financial model requires key inputs across several categories: cost of capital parameters (WACC, corporate tax rate, year 1 tax credit), project economics (target EPC profit margin, depreciation period, project lifespan), revenue assumptions (local electricity price per kWh, exchange rate, annual price escalation), debt financing terms (minimum and average DSCR, cost of debt, debt tenor, loan-to-value ratio), and operational factors (degradation rate, annual OpEx/O&M costs, cost inflation, and residual value). These financial input terms for utility-scale solar projects can seem complex, but don't worry — we've broken each one down into simple explanations and included the default values for your reference.
Financial Input
Explanation
Default Value
WACC (Weighted Average Cost of Capital)
The average rate a project must pay to borrow money and attract investors, combining the cost of debt (loans) and equity (ownership).
6%
Corporate Tax Rate
The percentage of tax a company must pay on project revenues.
30%
Yr 1 Tax Credit
The one-time tax credit applied in the first year of the solar plant operation.
30%
Target EPC Profit Margin
The profit percentage an EPC aims to earn on top of direct project costs.
15%
Depreciation Period
The period during which project assets can be depreciated for tax purposes, thereby lowering taxable income each year.
20 yr
Project Lifespan
The assumed operational duration of the solar project.
25 yr
Price/kWh (local currency)
The expected selling price of electricity generated, expressed per kilowatt-hour.
0.05
Local currency/USD exchange
The exchange rate between the project's local currency and U.S. dollars.
1
Annual price escalation
The yearly percentage increase in the electricity selling price.
2%
Minimum DSCR (Debt Service Coverage Ratio)
The lowest acceptable ratio of net operating income to debt service obligations.
1.3
Average DSCR
The average debt service coverage ratio over the loan's lifetime.
1.3
Cost of debt
Interest rate on borrowed project debt.
5.3%
Debt tenor
The length of time over which project debt must be fully repaid.
18 yr
Loan-to-value
The ratio of total debt financing to total project capital cost. It tells what portion of the project is financed with debt, and what portion must come from equity (your own or investors' money).
60%
Degradation rate
The annual percentage decline in solar module output due to aging.
0.5%
Annual OpEx/O&M Cost
The yearly cost of operating and maintaining the solar project, including labor, management, monitoring, maintenance, and insurance.
5000 $/MWp
Annual cost inflation
The expected yearly percentage increase in operating costs due to inflation.
2%
Residual value
The estimated remaining value of project assets at the end of the project's lifespan (may be recovered through resale).
0.2 $/Wp
Financial Outputs
Once a scenario is analyzed in Design Pro, you instantly get EPC Cost ($/W) and sLCOE ($/kWh). If you have multiple scenarios, you can choose to compare these scenarios. Additionally, you can download three Excel files with detailed information:
Bill of Quantities
EPC Cost Estimate
Financial Report
Comparing Multiple Scenarios
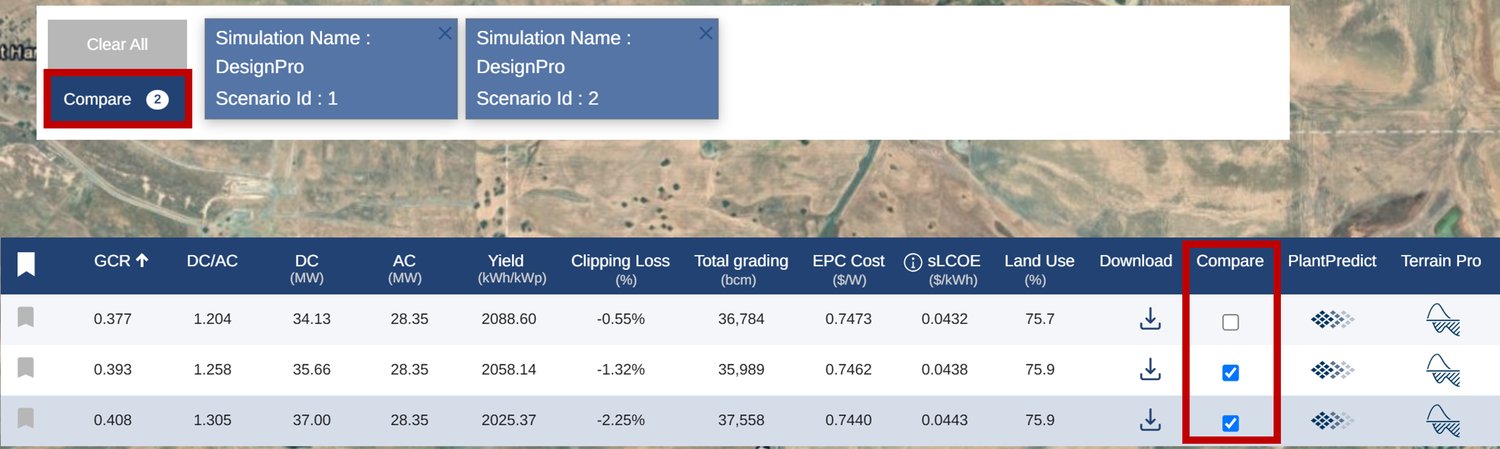
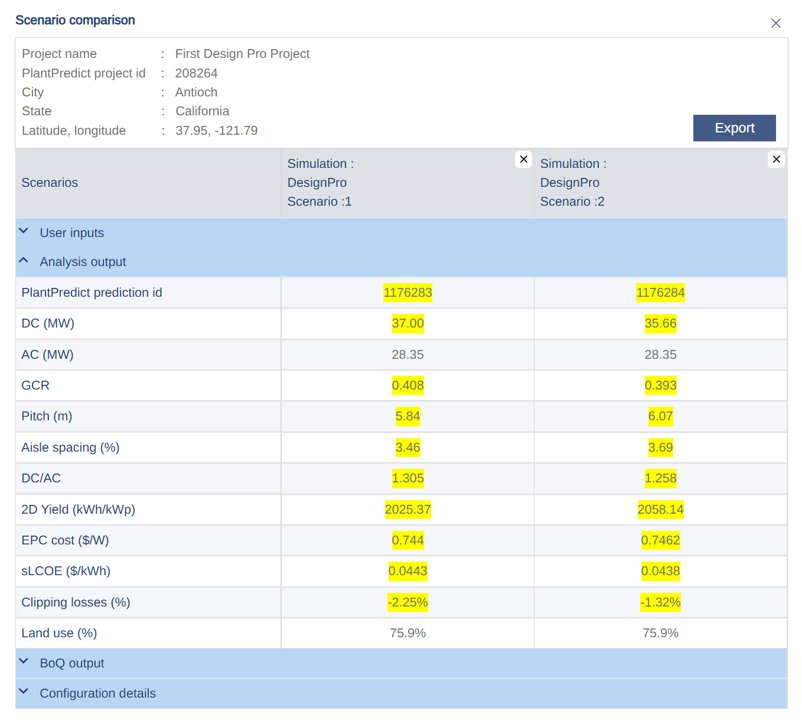
If you want to compare multiple Design Pro scenarios, check the box for each scenario and click the Compare button.
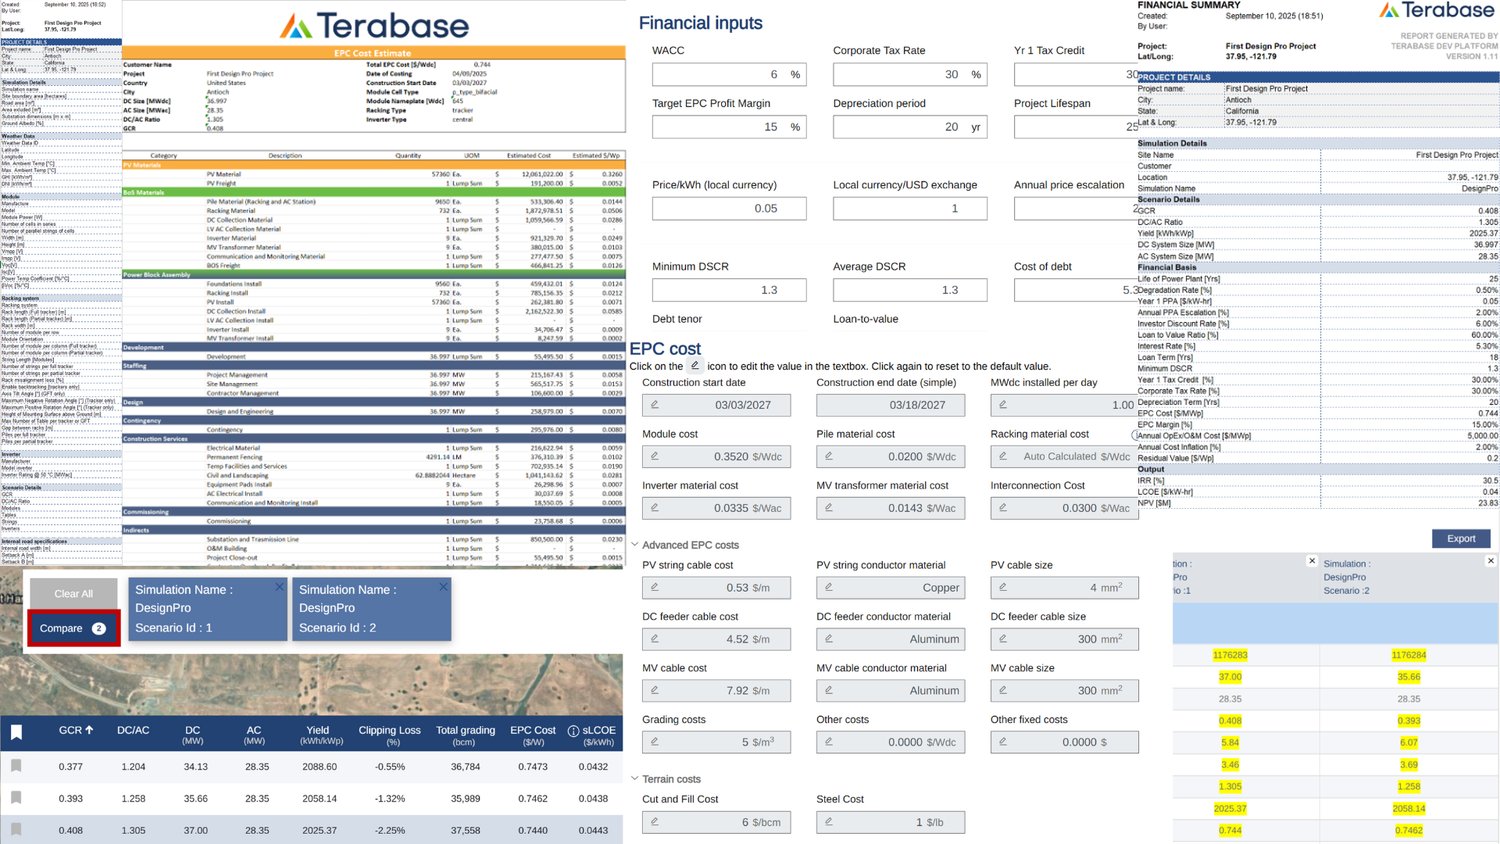
This opens the Scenario Comparison table, which includes User Inputs, Analysis Output, BoQ Output, and Configuration Details. The quantities highlighted in yellow differ between the two scenarios. To export the comparison table as an Excel sheet, simply click the Export button.
Bill of Quantities (BoQ)
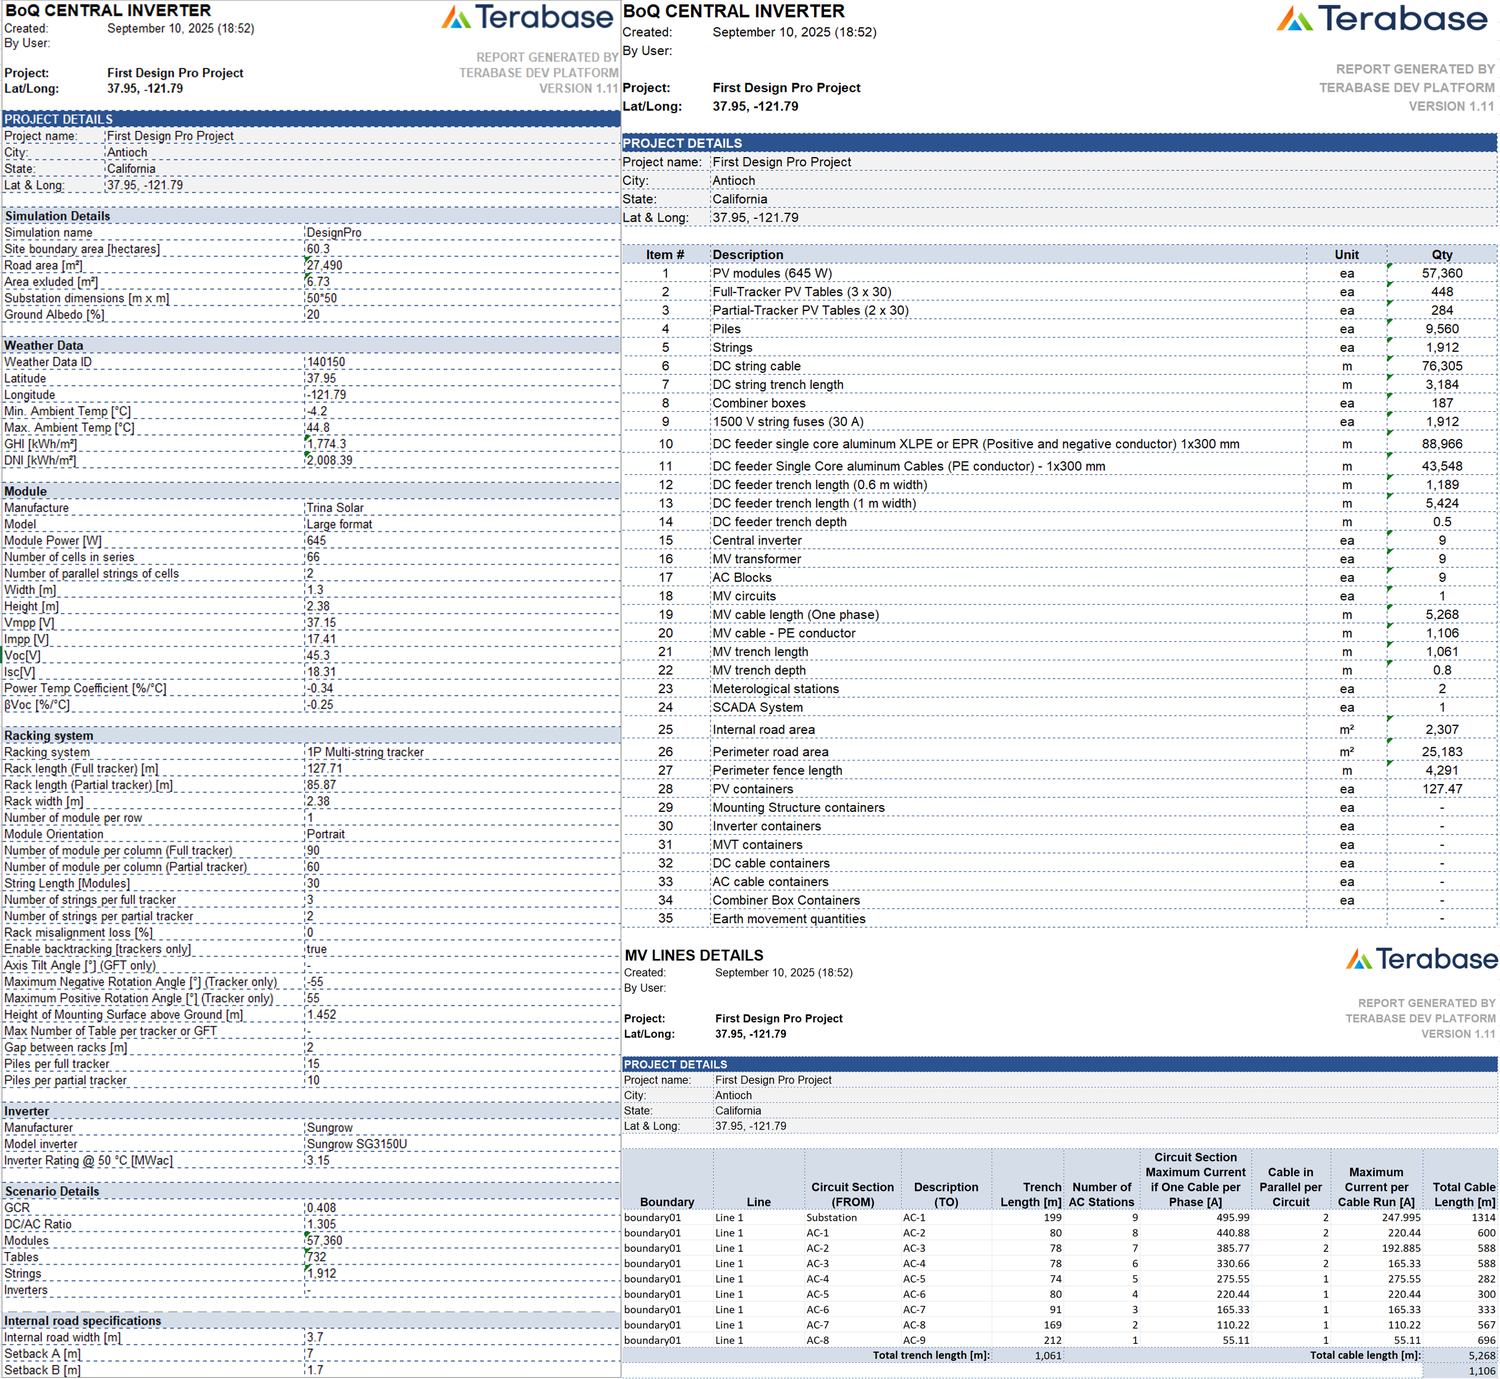
The Bill of Quantities (BoQ) Excel sheet has three tabs: Report, BoQ Central Inverter, and MV Lines Detail.
The Report tab provides Project Details, Simulation Details, Weather Data, Module info, Racking System info, Inverter info, Scenario Details, and Internal Road Specifications.
The Bill of Quantities (BoQ) for the Central Inverter tab lists the various items used in the project along with their respective quantities.
Lastly, the MV Lines Details tab presents a breakdown of the trench length and cable length by area, as well as the total lengths.
EPC Cost Estimate
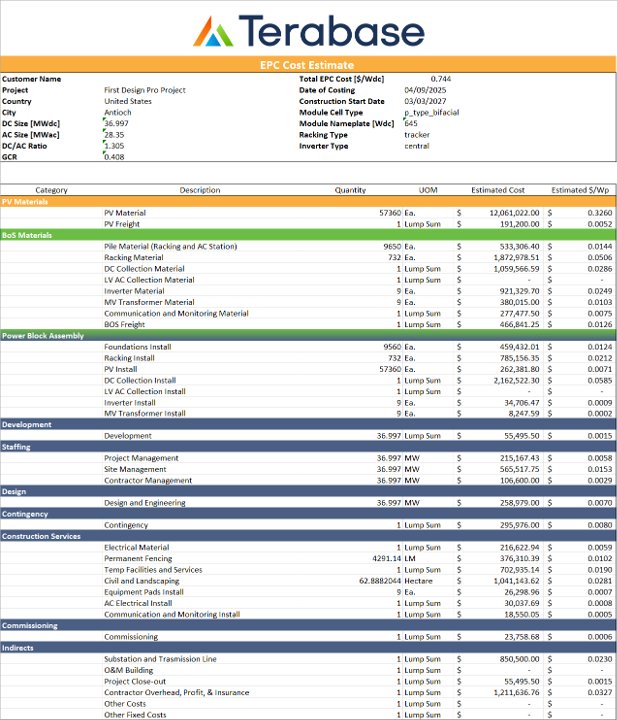
The EPC Cost Estimate Excel sheet is organized into two main sections. The first section presents a project summary table, highlighting key figures such as the overall EPC cost estimate. For example, in the case shown below, the estimated EPC cost is $0.744/Wdc. The second section provides a detailed cost breakdown across ten distinct categories, offering greater insight into the distribution of expenses.
Financial Report: Automated LCOE and PPA Price Calculator
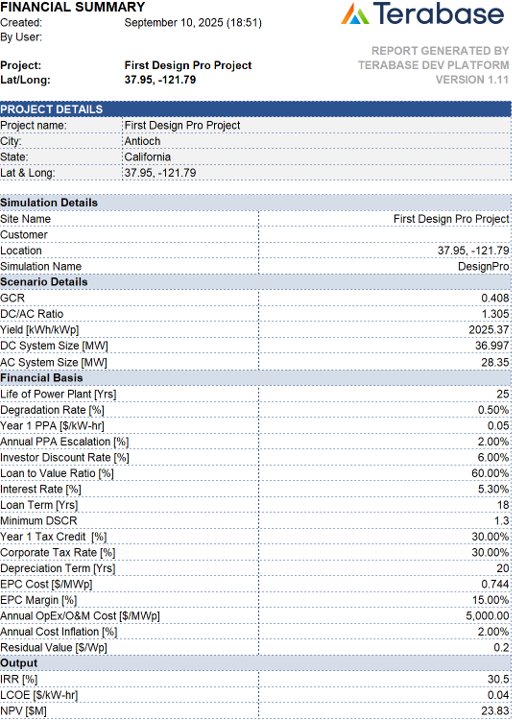
The Financial Report Summary Tab consolidates project details, simulation results, scenario assumptions, financial basis, and final outputs into a single report. The Financial Basis includes key assumptions such as plant life, degradation rate, Year 1 PPA, annual PPA escalation, discount rates, debt financing terms, EPC costs, O&M costs, inflation, and residual value. From these inputs, the tool calculates essential financial indicators: Internal Rate of Return (IRR), Levelized Cost of Energy (LCOE), and Net Present Value (NPV).
IRR of a project shows how fast your investment grows each year. The higher the IRR, the better the project is at making money. NPV tells you whether the project is truly worth it in today's money, after considering time, risk, and investment cost.
In the example below, the IRR is 30.5%, LCOE is $0.04/kWh, and NPV is $23.83 million. Together, IRR, LCOE, and NPV provide a comprehensive picture of project feasibility, investment attractiveness, and long-term financial performance.
The Financial Report Excel sheet also includes an in-depth Outputs tab, which presents Revenue, EBITDA, EBIT, Earnings Before Tax, Profit, and Cash Flow for each year of the project's duration.
How Does Early LCOE Insight De-Risk Green-Lighting?
Early insight into Levelized Cost of Energy (LCOE) de-risks the green-lighting of utility-scale solar projects by aligning technical design with financial viability before major commitments are made. Below are four major benefits of analyzing LCOE at an early stage of the project:
Avoid Costly Redesigns: If LCOE is calculated only after the design is complete, developers may realize too late that the project is not cost-competitive. Gaining early insight allows for the optimization of layouts, technology choices, and equipment selections from the beginning.
Improve Bankability: Investors and lenders use the LCOE as a key measure of competitiveness. Presenting robust, data-driven LCOE projections from the outset fosters confidence and mitigates financing risks.
Accelerate Approvals: By linking LCOE to the design phase, developers can provide clear financial justification during permitting, utility negotiations, and investment proposals, thus streamlining decision-making.
Mitigate Uncertainty: Considering site-specific factors (e.g., solar resources, interconnection costs, and EPC pricing) early on helps to identify risks that could derail the project later.
By embedding financial modeling into the earliest stages of utility-scale solar design, Design Pro transforms LCOE from a retrospective calculation into a proactive design driver. That means fewer surprises, faster approvals, and more substantial investor confidence from concept to commissioning.
Ready to futureproof your modeling workflow?
Join hundreds of organizations that trust PlantPredict for bankable energy predictions. Start with a free account, get a free trial of Pro features, or book a demo with our team.